Raspberry Pi 4를 사용한 Cluster 상에서 온도 모니터링 방법을 정리했습니다. node_exporter의 textile_collector와 crontab을 활용하는 방법을 참고해서 작성했습니다. 단, crontab 자체의 Resolution 문제로 분단위로 온도정보를 취합하며, 이보다 더 높은 Resolution의 경우 좀더 민첩한 프로그램언어로 작성해서 systemd 서비스로 등록하는 것을 추천합니다. (추후 진행해 볼 예정입니다. :) )
Installing vcgencmd
Collecting GPU temperature, you need to install an useful tool vcgencmd in
an unofficial PPA. You can add the ppa:ubuntu-raspi2/ppa repository, but
that repository only supports the LTS version like xenial and bionic.
If the installed ubuntu was not the LTS version, you should change the source
list file at /etc/apt/sources.list.d/ubuntu-raspi2-ubuntu-ppa-<codename>.list
like this.
# I have installed Ubuntu 19.10 eoan version, so that I change the repository
# distribution from eoan to bionic

# Add repository
sudo add-apt-repository ppa:ubuntu-raspi2/ppa;

# Change distribution version to bionic
sudo cp /etc/apt/sources.list.d/ubuntu-raspi2-ubuntu-ppa-eoan.list \
        /etc/apt/sources.list.d/ubuntu-raspi2-ubuntu-ppa-eoan.list.save;
sudo sed -i 's/eoan/bionic/' /etc/apt/sources.list.d/ubuntu-raspi2-ubuntu-ppa-eoan.list;

# Update and install libraspberrypi-bin
sudo apt update;
sudo apt install -y libraspberrypi-bin;
Make collecting script
To collect the node_exporter friendly output, make a script file on the
/usr/local/bin/raspi-sensors-collector.sh with the following code. For the
detail usage of the texfile_collector, you can see the README file at
/var/lib/prometheus/node-exporter/README.textfile.
#!/bin/bash
CPU_TEMP=$(cat /sys/class/thermal/thermal_zone0/temp);
CPU_HIGH=$(($CPU_TEMP / 1000));
CPU_LOW=$(($CPU_TEMP / 100 % $CPU_HIGH));
GPU_TEMP=$(/usr/bin/vcgencmd measure_temp | cut -d "=" -f 2 | sed "s/['C]//g");

OUTPUT_FILE=/var/lib/prometheus/node-exporter/raspi-sensors.prom;

# Store sensing data into temporary output
echo "node_raspi_temp{device=\"cpu\"} ${CPU_HIGH}.${CPU_LOW}" >> ${OUTPUT_FILE}.$$;
echo "node_raspi_temp{device=\"gpu\"} ${GPU_TEMP}" >> ${OUTPUT_FILE}.$$;

# Rename the output file
mv ${OUTPUT_FILE}.$$ ${OUTPUT_FILE};
And add execute permission to the script.
sudo chmod +x /usr/local/bin/raspi-sensors-collector.sh;
Add cron jobs
To run raspi-sensors-collector.sh every minute, run sudo crontab -e and
add the following job item.
* * * * * /usr/local/bin/raspi-sensors-collector.sh
If you stored the crontab job, you can search the sensor result in the
/var/lib/prometheus/node-exporter/raspi-sensors.prom and see the contents of
that file like this.
node_raspi_temp{device="cpu"} 61.3
node_raspi_temp{device="gpu"} 61.0
Checking on the Prometheus
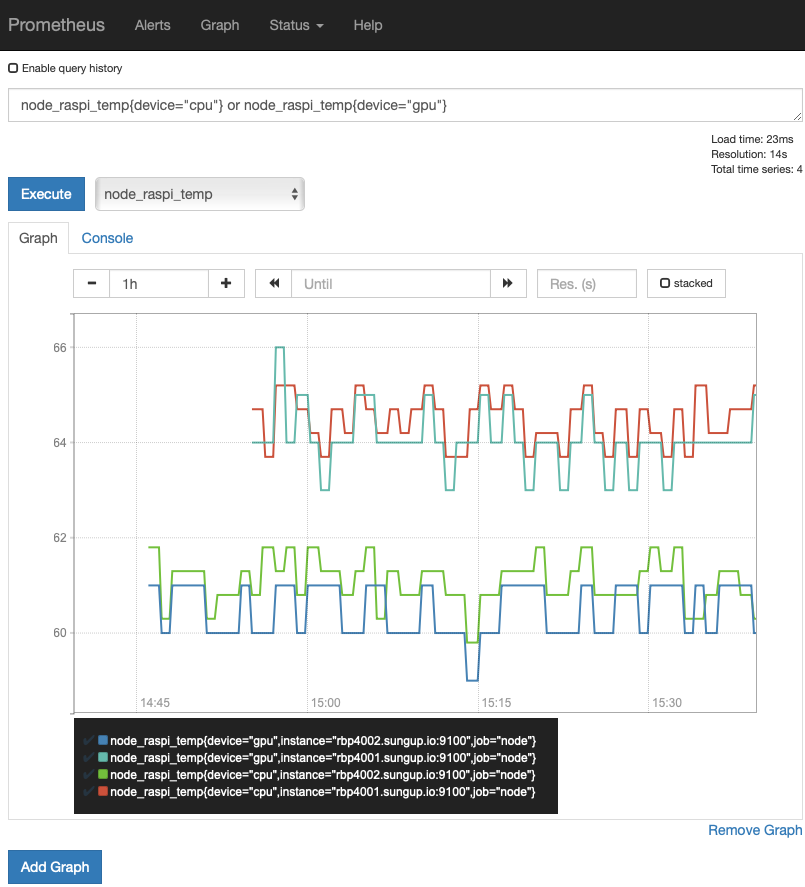
You can access prometheus (http://<prometheus-server>:9090/graph) and query
the following test.
node_raspi_temp{device="cpu"} or node_raspi_temp{device="gpu"}
As a result of that query, you can see the result graph like this.