
Grafana를 설치하여 Prometheus와 연결 및 모니터링하는 환경을 구축하는 내용입니다. Grafana의 경우 Ubuntu/CentOS 관계없이 기본 Repository에서는 제공하고 있지 않으며, Grafana Official Site에서 제공하는 별도의 Repository를 등록해야 합니다.
Prerequisite
Before install Grafana, install prometheus and node_exporter. Check following articles.
- CentOS: Prometheus on CentOS 8
- Ubuntu: Prometheus on Ubuntu 19.10
Install Grafana
Register Grafana repository and Install packages
Basically, CentOS and Ubuntu doesn’t support Grafana package files. To install Grafana, you must register the grafana repository on each OS environments.
CentOS
To install Grafana on CentOS, you should make repository config file on
/etc/yum.repos.d/grafana.repo. Make and edit that file using editor.
[grafana]
name=grafana
baseurl=https://packages.grafana.com/oss/rpm
repo_gpgcheck=1
enabled=1
gpgcheck=1
gpgkey=https://packages.grafana.com/gpg.key
sslverify=1
sslcacert=/etc/pki/tls/certs/ca-bundle.crt
After store that config file, run yum or dnf command to install Grafana.
Using YUM (CentOS 7, RedHat 7 and old Fedora)
sudo yum update -y;
sudo yum install grafana;
Using DNF (CentOS 8, RedHat 8 and latest Fedora)
sudo dnf update -y;
sudo dnf install grafana;
Ubuntu
Different from CentOS, simply run 5 commands on terminal to install Grafana.
# 1. Install apt-transport-https because official repository runs only https protocol.
sudo apt install -y apt-transport-https;

# 2. Install dependencies.
sudo apt install -y software-properties-common wget;

# 3. Add repository and it's keys.
sudo add-apt-repository "deb https://packages.grafana.com/oss/deb stable main";
wget -q -O - https://packages.grafana.com/gpg.key | sudo apt-key add -

# 4. Install grafana
sudo apt install grafana;
Start and enable grafana-server
After install packages, you can start and enable grafana-server to run background.
sudo systemctl start grafana-server;
sudo systemctl enable grafana-server;
Setup WEB UI configuration
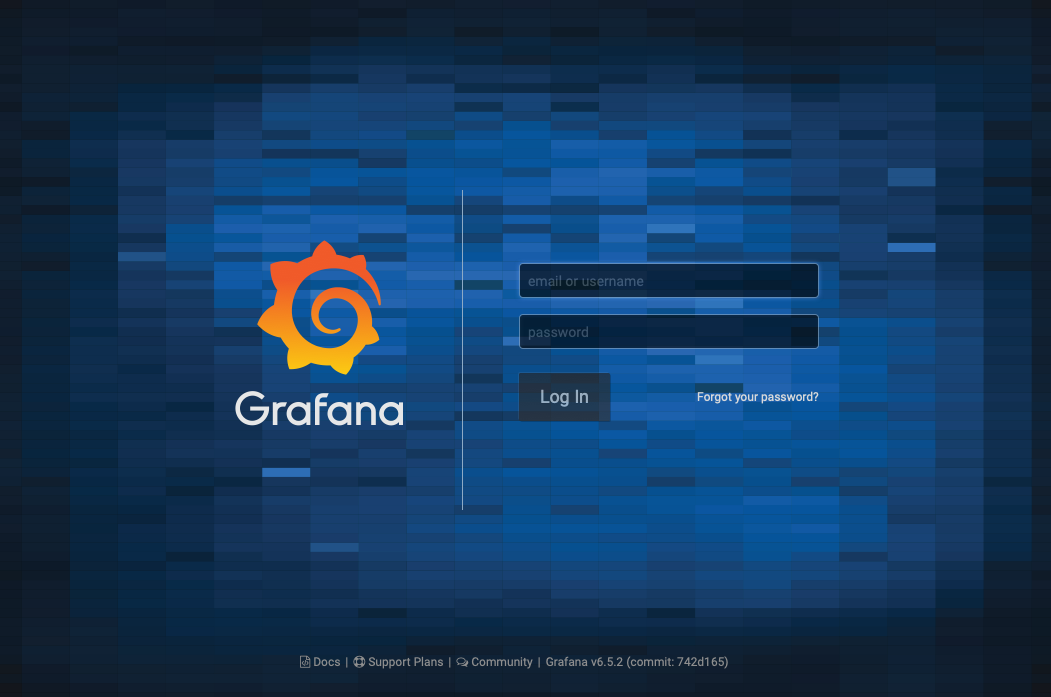
You can access http://<grafana-server>:3000 from a web browser and login with
admin/admin credential. At the first login, you have to change the password
of the admin account. After logged, following page will be appeared as the
home dashboard.
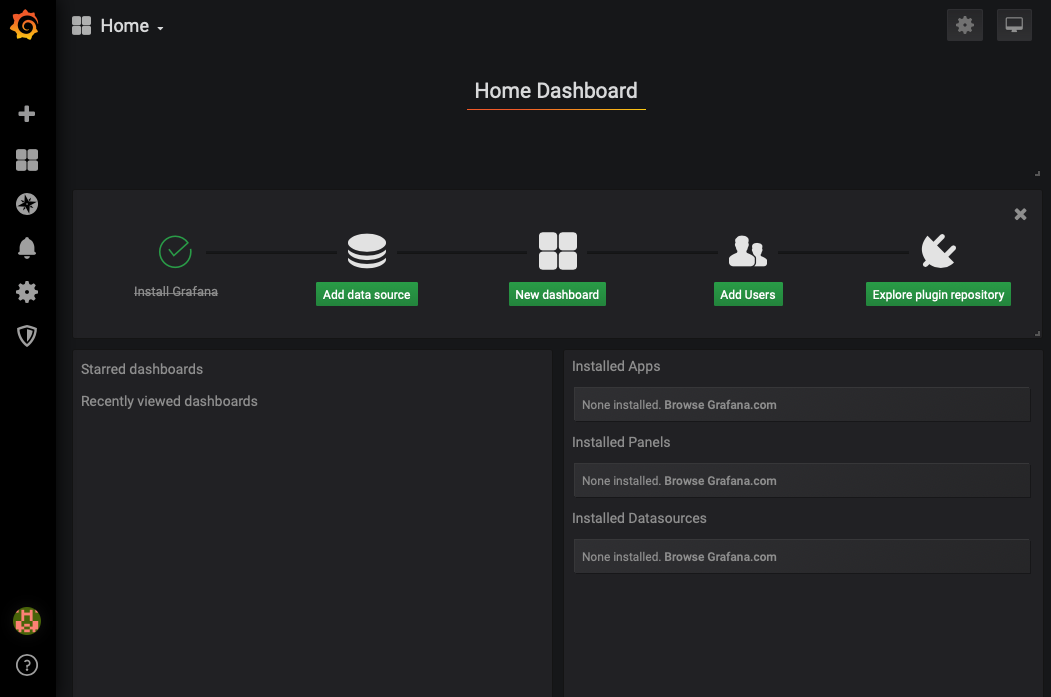
Add data source
To add data source from prometheus, you can click Add data source in the
home dashboard.
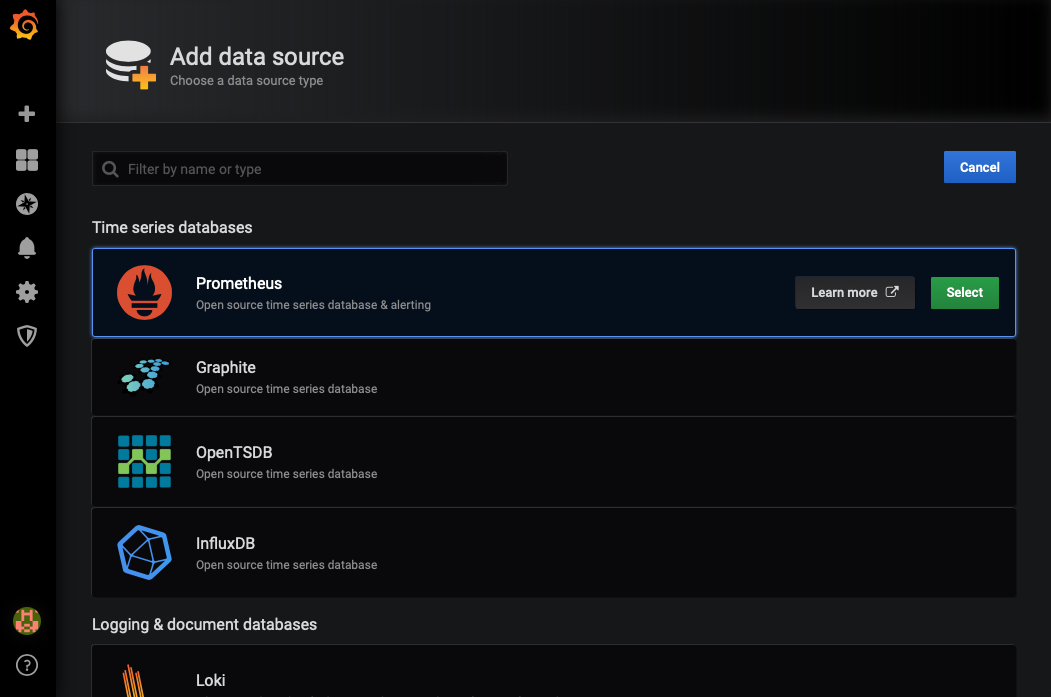
At the Add data source screen, click Select on the Prometheus item.
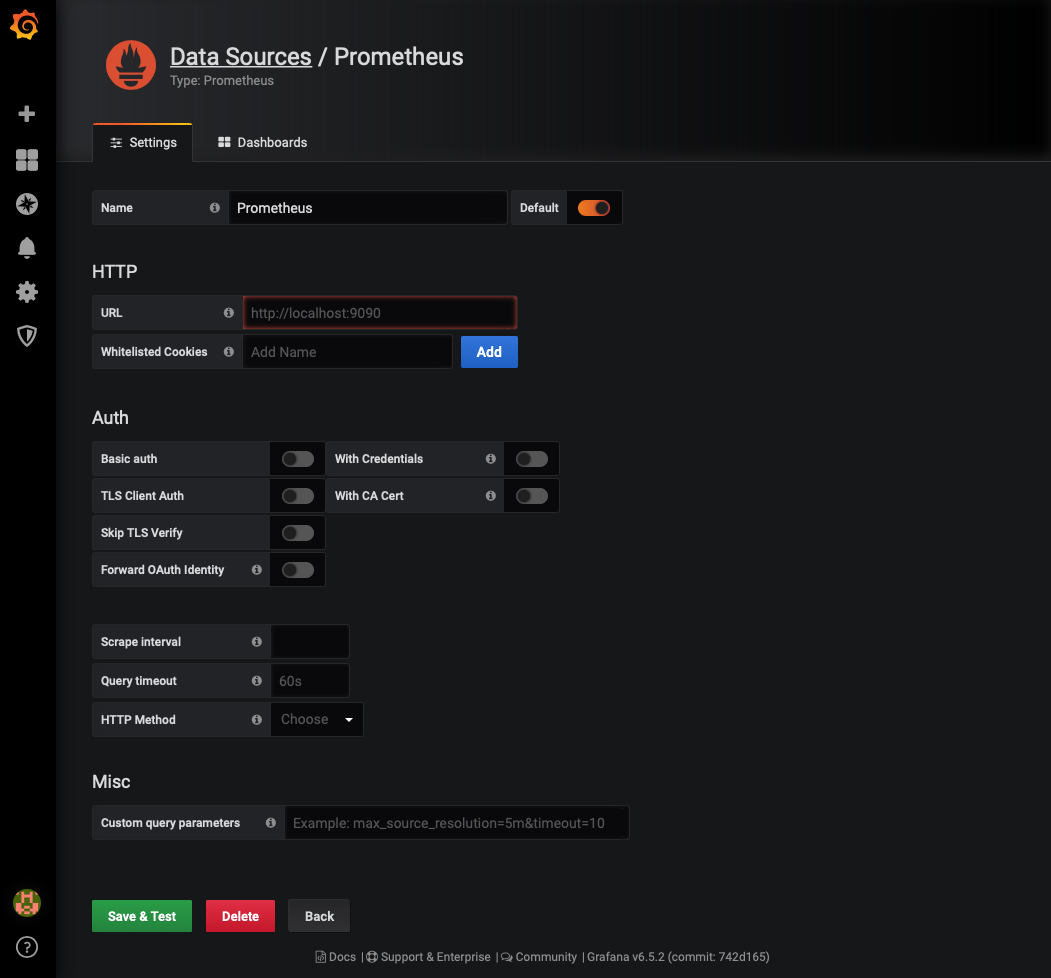
For the prometheus, you must insert the prometheus’ URL and click
Save & Test. In the setting pages, URL field suggests the default prometheus’
URL, but not inserted. You can insert that field with the default value
http://localhost:9090, or insert other prometheus main server URL if you
installed prometheus on the seperate server.
If pass the connection test for the prometheus, return to the home dashboard.
Add the new dashboard
Before create the new dashboard, you can find many good dashboard templates
in the official grafana site. In this
article, I will use the Node Exporter Server Metrics dashboard to monitor
multiple servers.
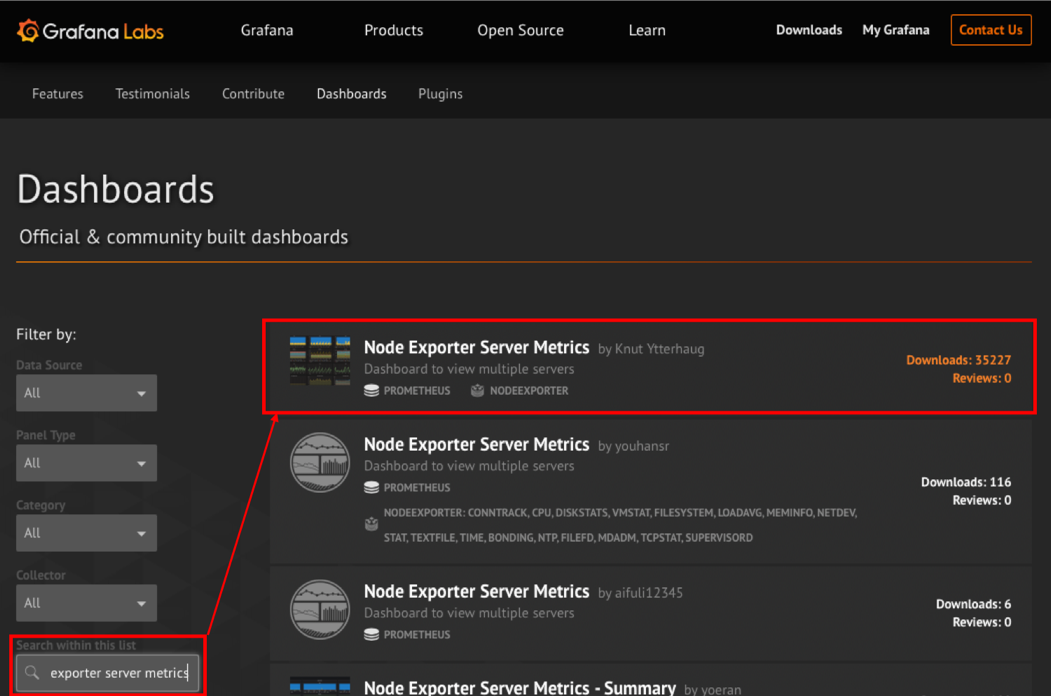
First, you can access official grafana site and search the
Node Exporter Server Metrics using the left side filter panel. At the top
of filtered list, you can find the Node Exporter Server Metrics by
Knut Ytterhaug and click that to get the detail information.
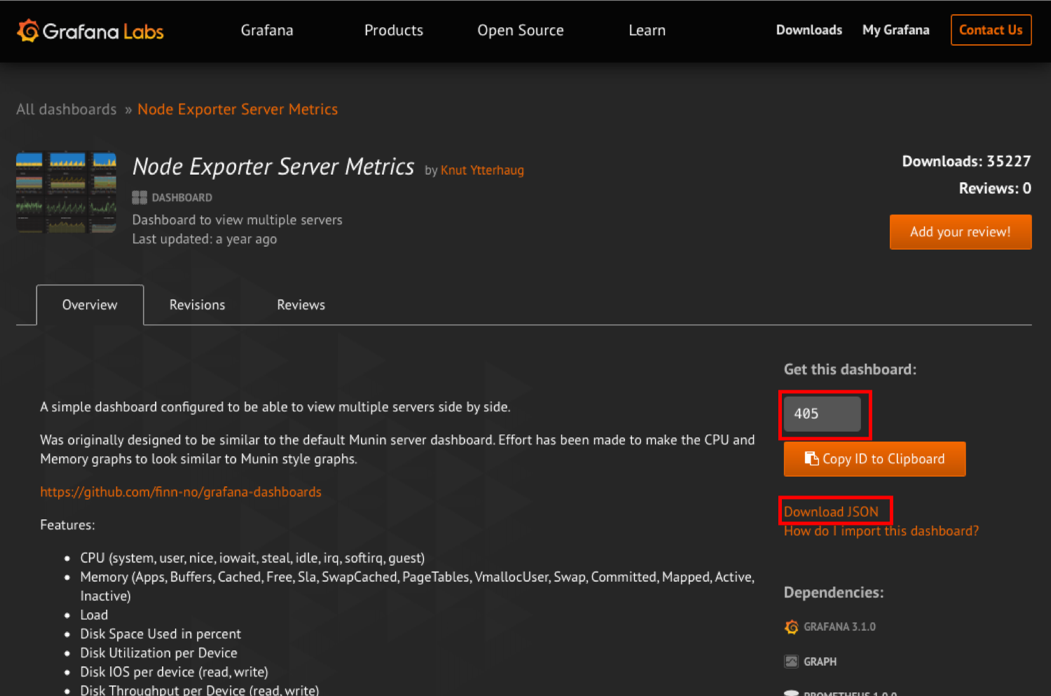
In the detail page, you must remember the ID number at the right panel or
download JSON file to click Download JSON link. The installed grafana on your
server downloads the JSON template file and apply that using the ID number.
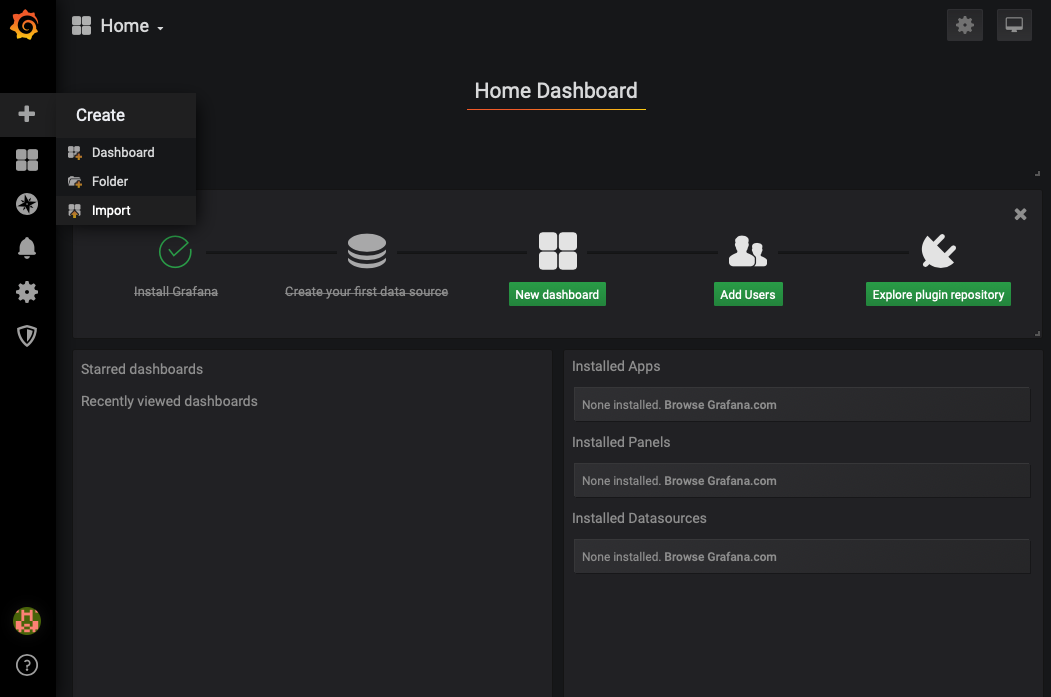
Return to your grafana server, you can click + - Create - Import menu to
import the grafana dashboard.
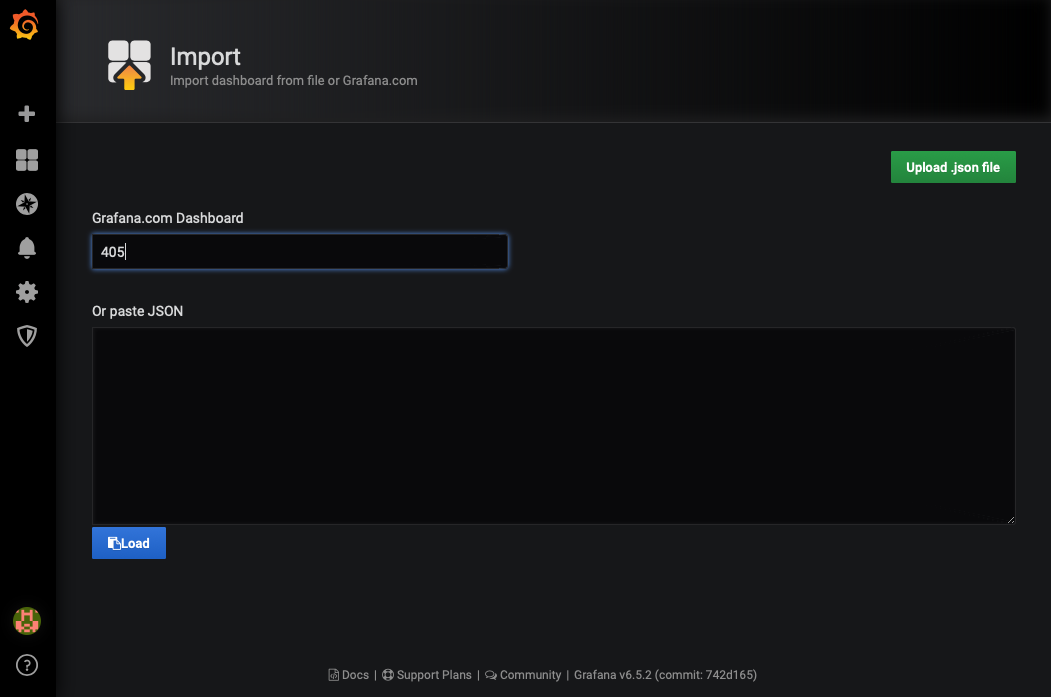
In the import page, insert the dashboard’s ID number or upload the downloaded JSON file. After insert the number, import pages shows the detail configuration automatically.
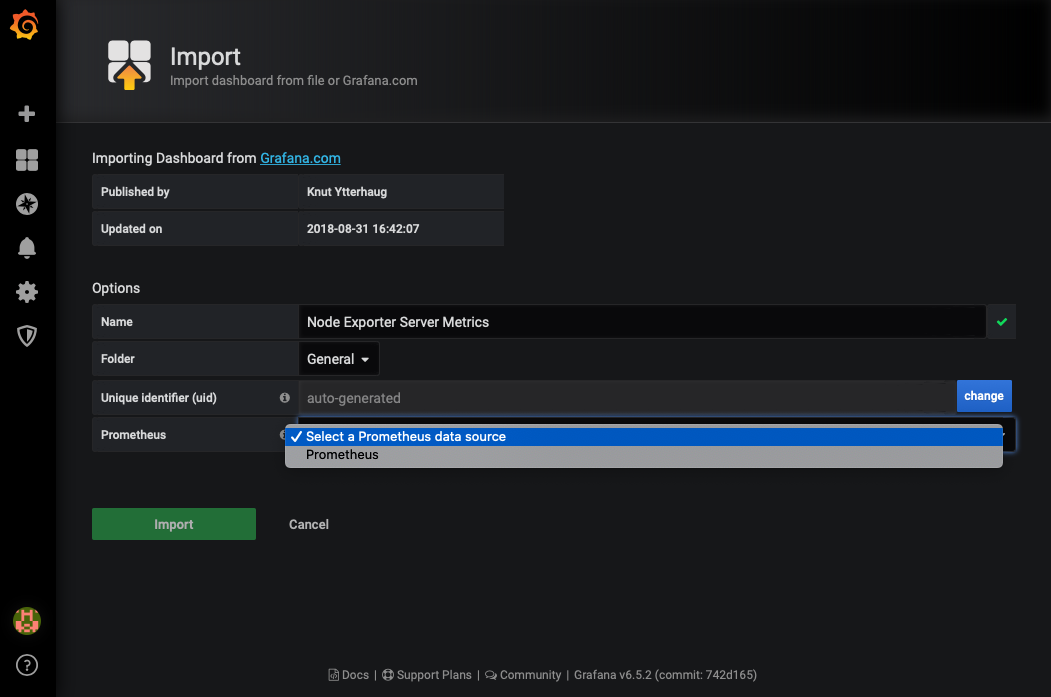
You can keep all of settings about dashbaord without prometheus field. At the prometheus fields, select the exact data source added before.
If you select the prometheus’ data source, click Import. After that, you can
see the Node Exporter Server Metrics dashboard like this.
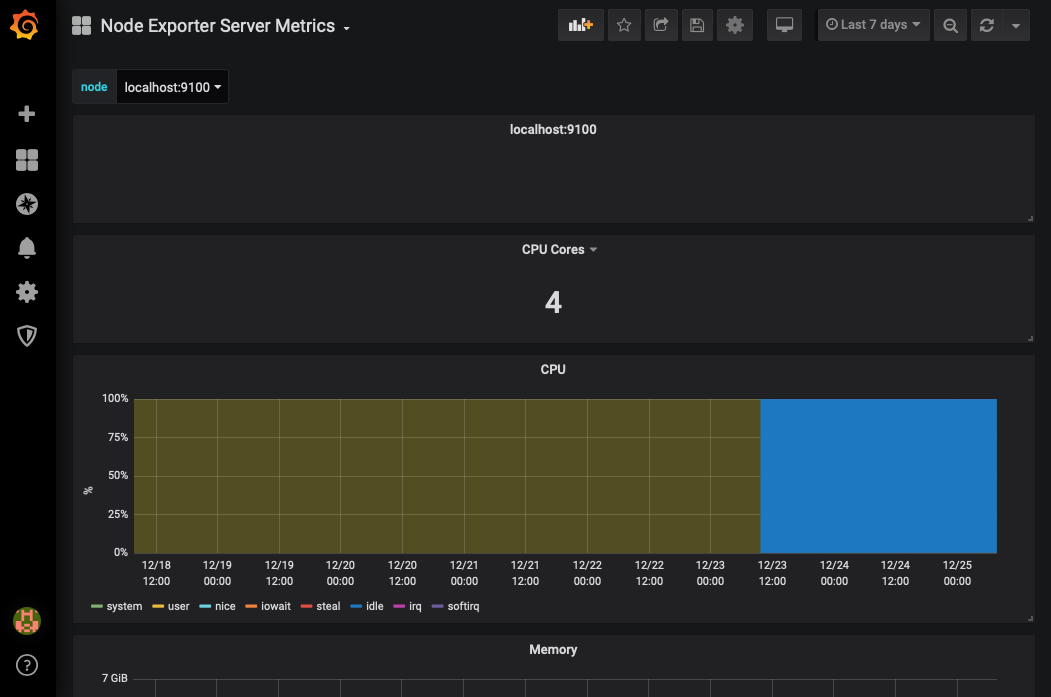
Currently, I’m using the following 3 dashboards:
- Node Exporter Server Metrics by Knut Ytterhaug: To monitoring one more servers.
- Node Exporter Full by idealista: For the detail monitoring only 1 server.
- Linux Hosts Metrics | Base by Rune Rønneseth: For the detail monitoring 1~3 servers.